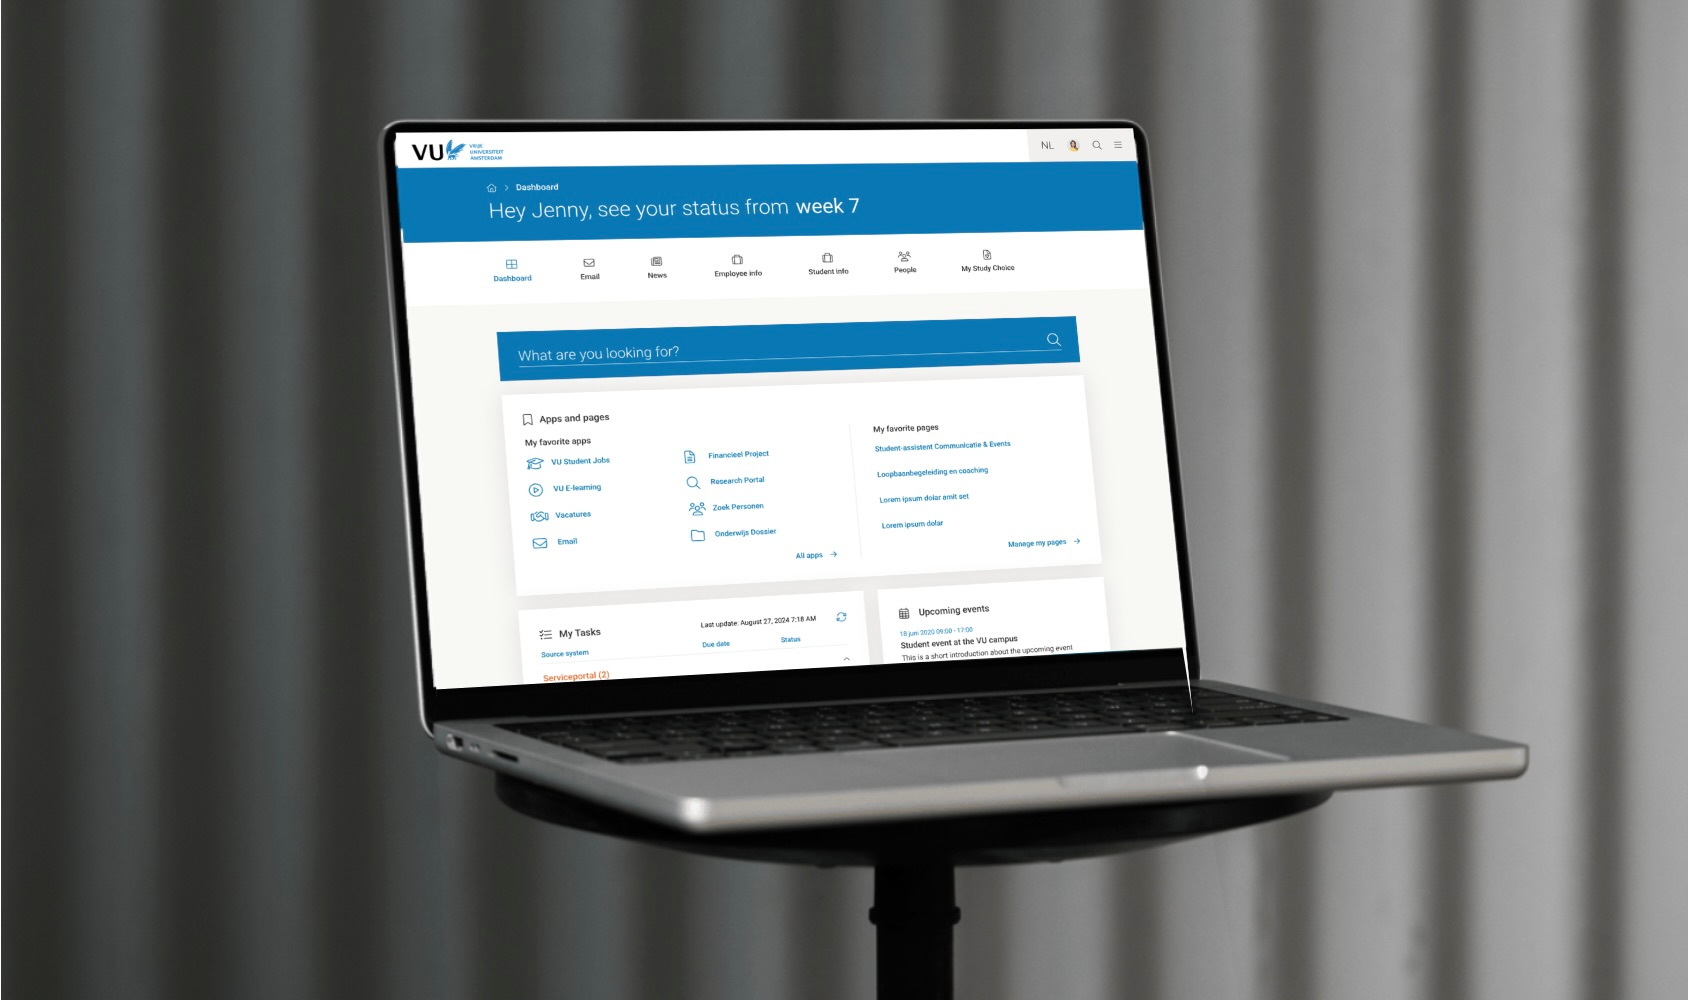
Employee Dashboard

Role Lead UX Designer & Researcher
The Team Communication & Marketing, Product Owner, and Developers.
Skills Quantitative and Qualitative User Research, Stakeholder Management, Information Architecture, Interactive Prototyping, Visual Design, Usability Testing
Employee Dashboard Preview

VU Amsterdam employees faced two critical workplace problems: an outdated, inflexible dashboard and a fragmented IT landscape with scattered self-service tools across multiple platforms. This created a non-centralized starting point for daily work meant employees wasted time hunting for tools and relevant information across disconnected systems.

Solution

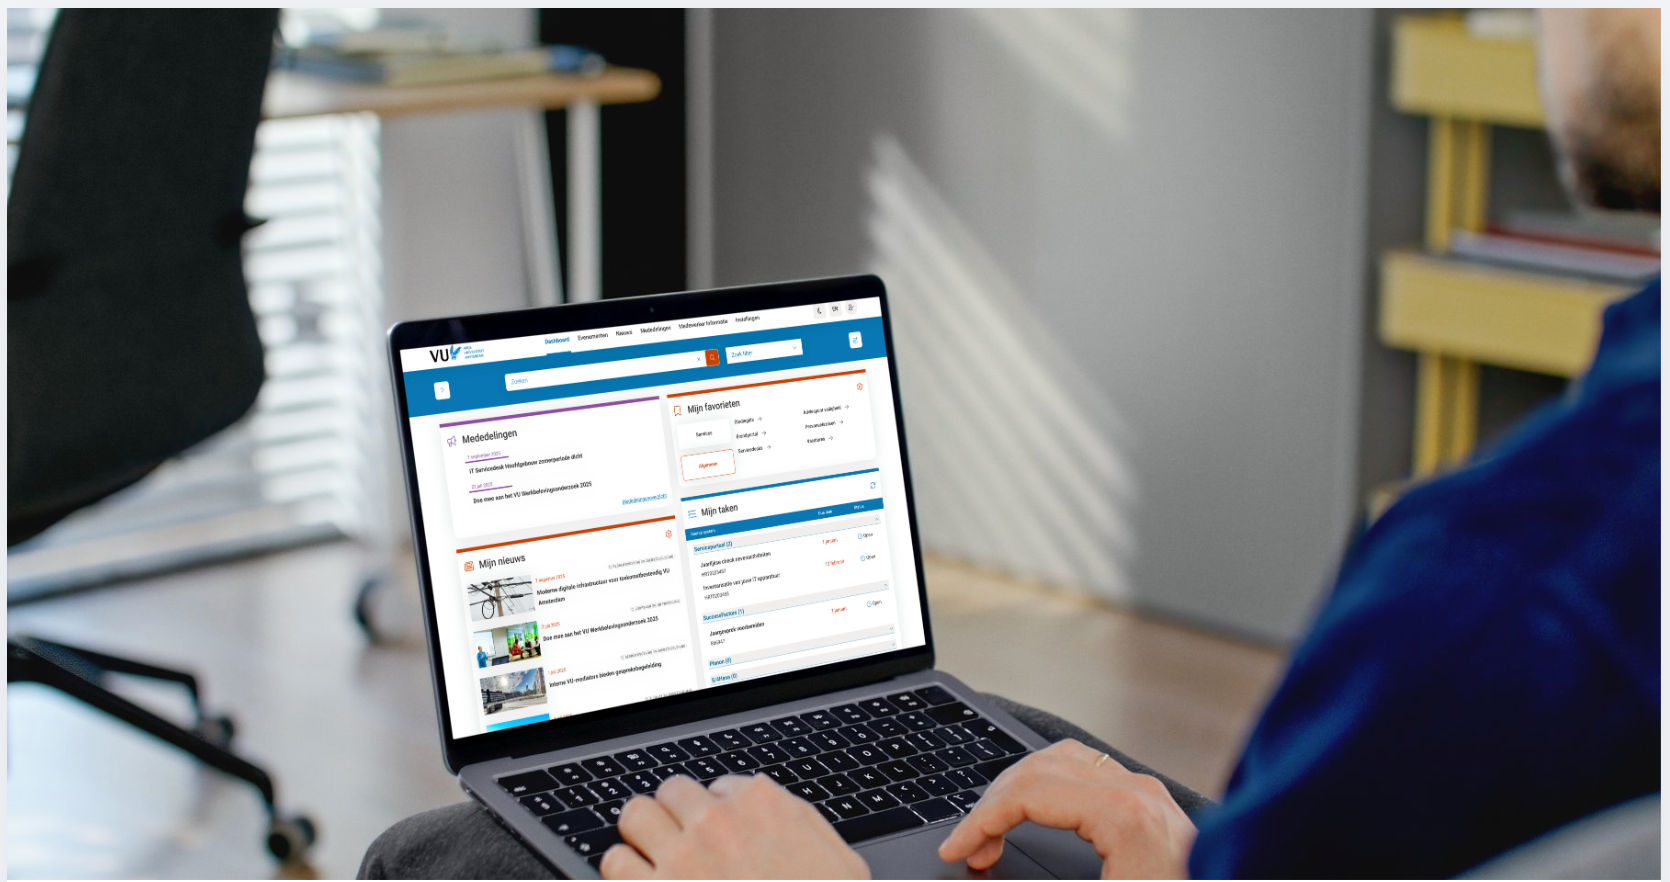
Consolidated scattered self-service tools and information into a single, customizable dashboard that serves as the daily work starting point for all VU Amsterdam employees.

By integrating various self-service tools and essential information into a unified dashboard, VU Amsterdam employees gained a personalized hub for their daily tasks. This eliminated the need to navigate multiple platforms, streamlining workflows and improving overall efficiency. As well as increasing interest in content provided by the VU.

Personalised Content

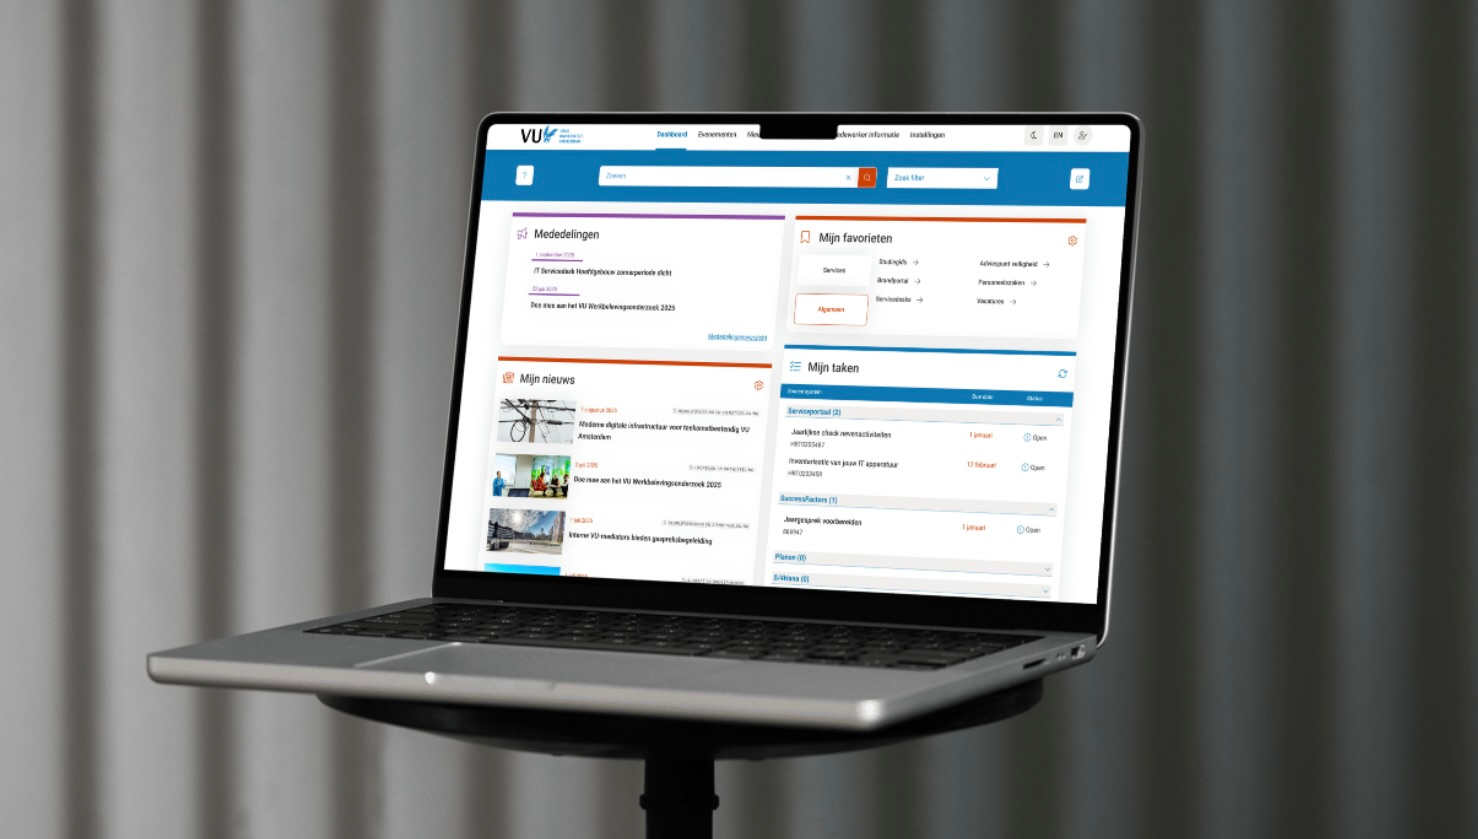
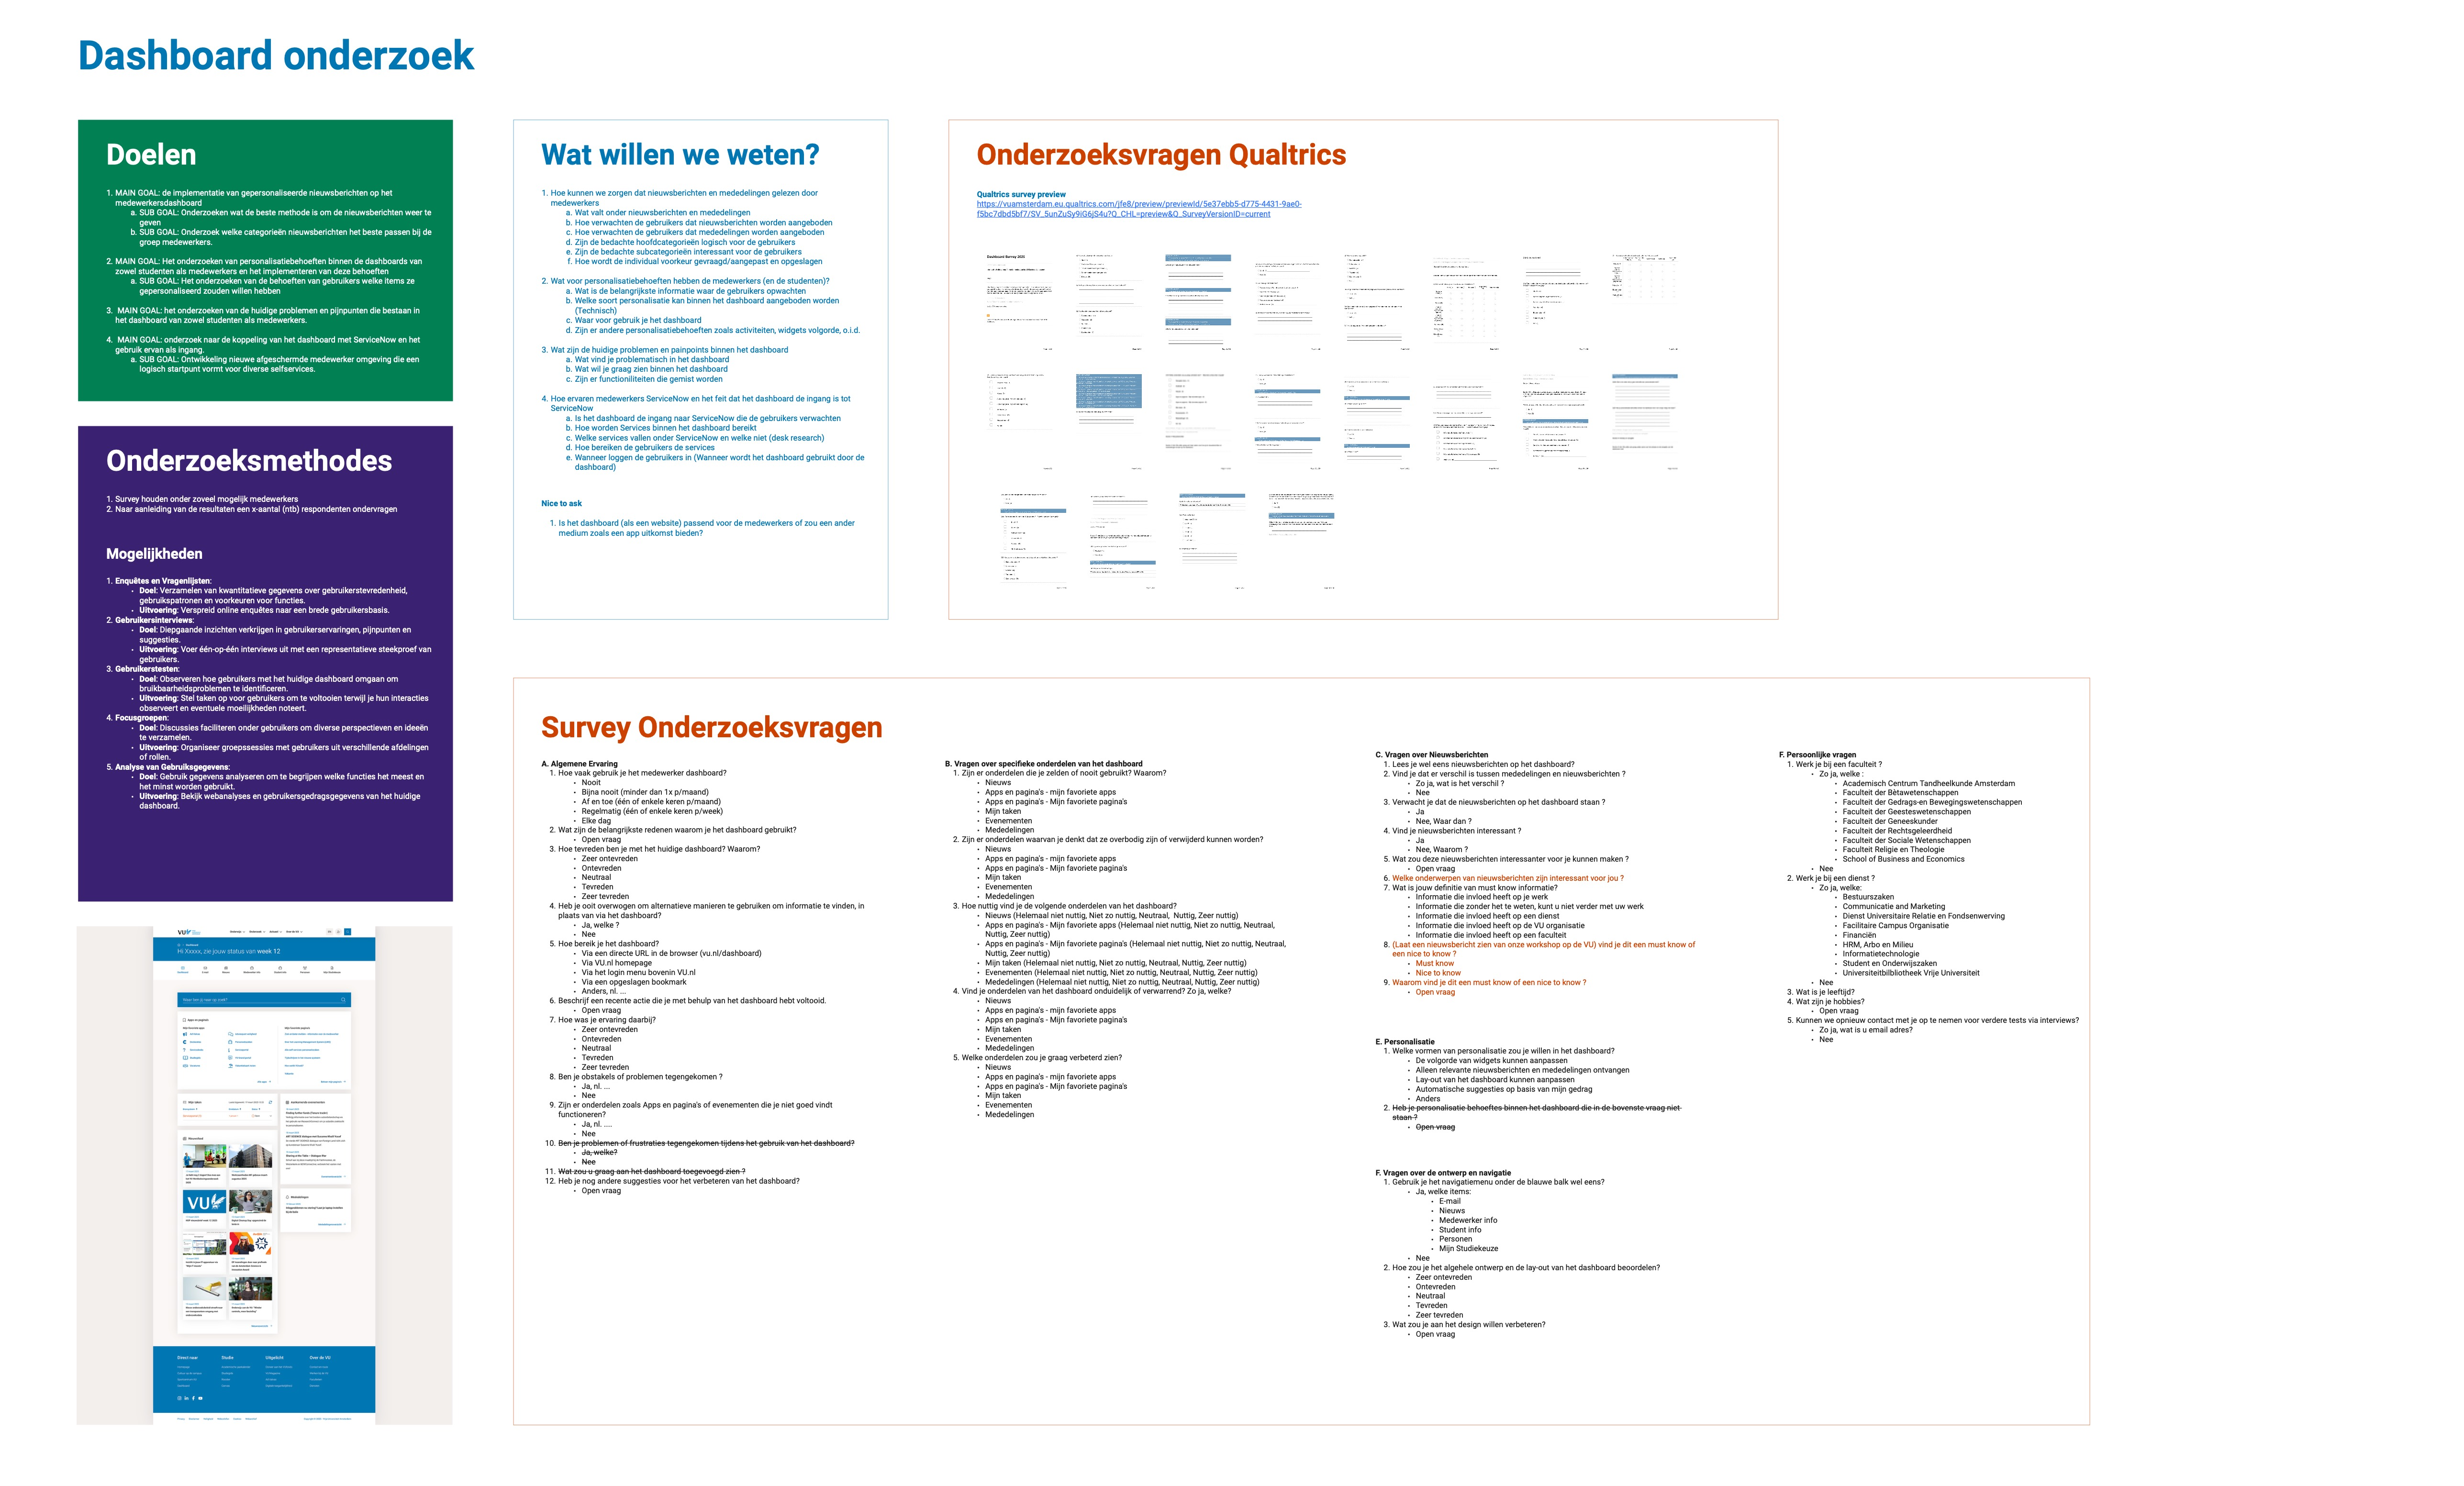
"Must know" mandatory and "Nice to know" personalized content structure

Flexible Layout

Customizable dashboard sections accommodating different work styles

Information Bundeling

Transform scattered data into a centralized hub, enhancing user experience

Visual Efficiency

Improving clarity & readability as well as enhancing usability and user satisfaction.

Design Process

1

Discover

Conducted comprehensive survey across VU employees
Investigated current dashboard usage patterns and pain points
Analyzed scattered IT landscape and self-service tool accessibility
Explored the different target audiences within VU employee
Discover phase
2

Define

Analyzed the Quantitative and qualitative inputs of VU employees
Defined painpoints regarding personalisation (Both content and layout)
Aligned users needs and stakeholders goals
Categorized painpoints into critical/urgent and later to solve
Define phase
3

Design

Brainstormed ideas and solution to each user need
Created initial prototypes and sketches based on research findings
Created wireframes and mockups for key dashboard features
Design phase
4

Test

Created a fully functional Click-model
Conducted usability tests with users
Observed the users interaction and clicking behaviour
Identified areas for improvement based on user feedback
Test phase
5

Deliver

Created final designs based on user feedback from previous steps
Created design components and reusable elements
Held demos to update and include developement teams
Gave presentations to different stakeholder and the executive board of the VU
Deliver phase

Impact & Results

Improved Employee Satisfaction

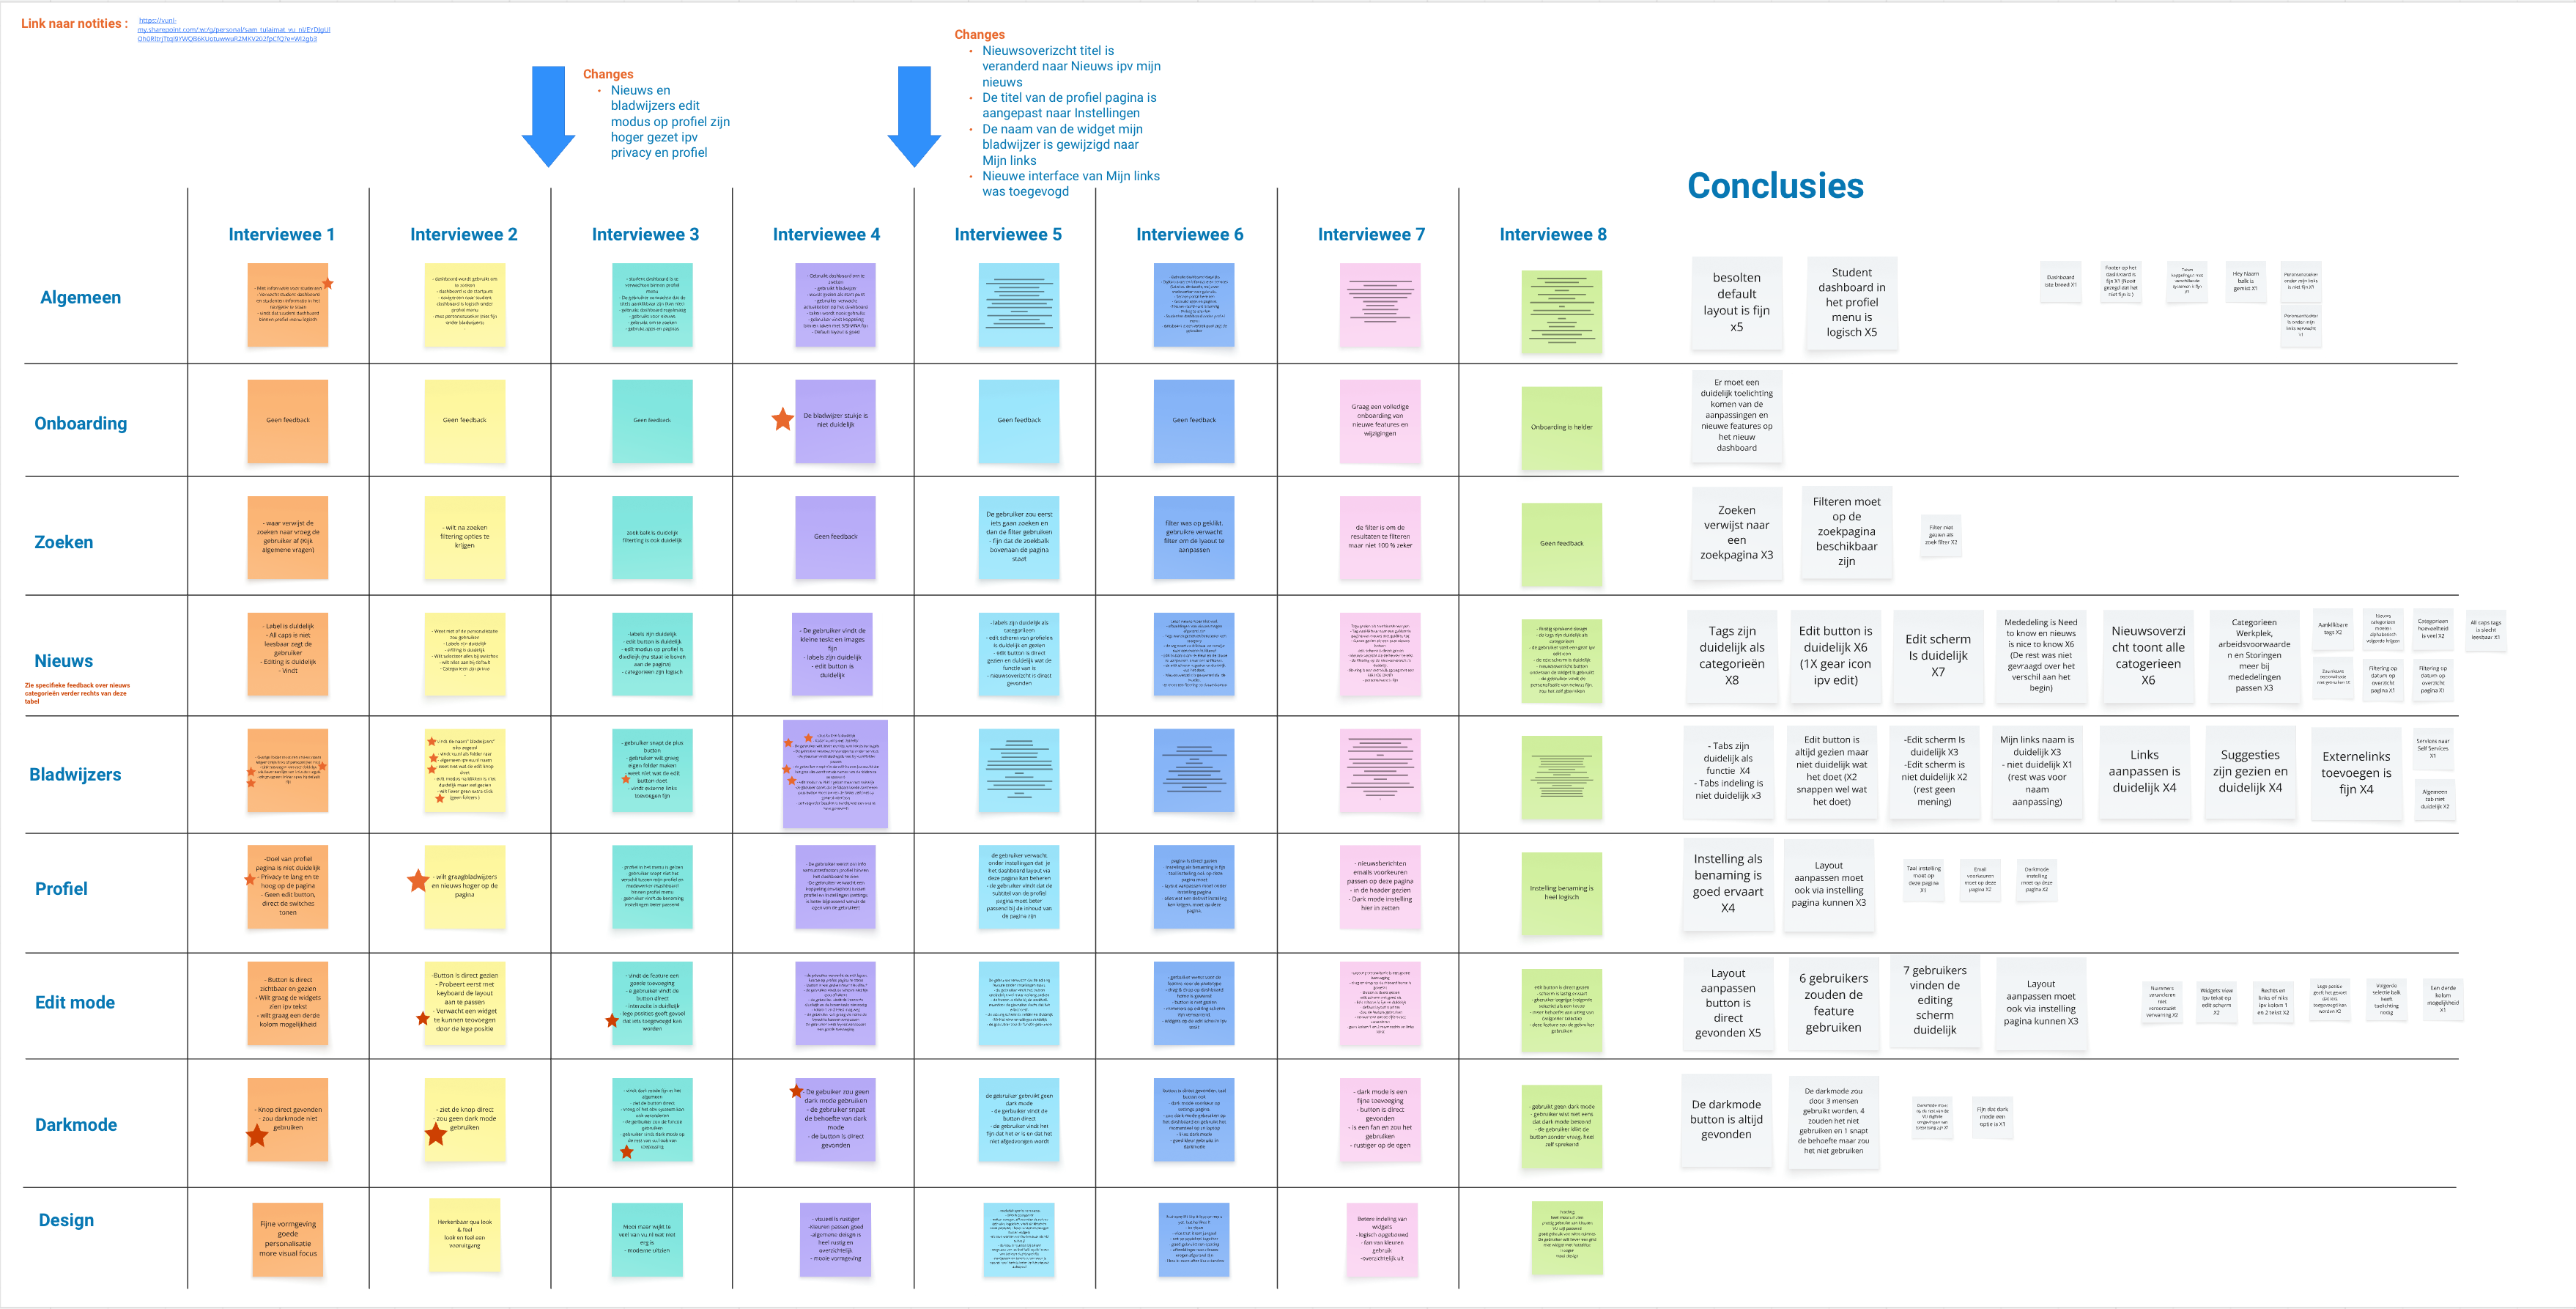
The improved dashboard design led to a noticeable increase in employee satisfaction, fostering a more positive work environment.

Enhanced Productivity

By streamlining access to essential tools and information, the new dashboard significantly enhanced employee productivity and efficiency.

Streamlined Workflows

The implementation of the dashboard resulted in more streamlined workflows, reducing the time spent searching for resources.

Better Data-Driven Decisions

With centralized data and analytics, the dashboard empowered employees to make better data-driven decisions, improving overall performance.

Increased User Engagement

The intuitive design and personalized content of the dashboard led to increased user engagement and adoption across the organization.

Reduced IT Support Tickets

The new dashboard helped reduce IT support tickets by providing employees with self-service tools and easy access to information.

Before and after

Before
Outdated, inflexible dashboard
Fragmented IT landscape
Scattered self-service tools
No centralized starting point
Time wasted hunting for tools
Inefficient design and usage of space
After
Personalized unified workspace
Consolidated tool access
Customizable layout and content
Single daily work starting point
Structured communication flow
Efficient design and negative space